Debugging PhoneGap Apps with the Chrome Dev Tools
PhoneGap/Cordova is a really cool framework for making mobile apps, but there is a dark side that isn't talked about enough. How to debug your apps? If you are writing any kind of non-trivial app, you will need something more than console.log and a lot of patience to debug your app. A partial solution to this issue is the Chrome Dev Tools. I say partial because apps which rely heavily on PhoneGap features won't work in Chrome, but if your app is more like a mobilized web site, you may benefit from this info.
I am assuming that you already have an app or two that you want to debug, so I won't cover anything about building PhoneGap apps here. I am just going to cover setting things up so you can use Chrome's Dev Tools to debug your app. This is the Windows 7 version of the instructions. I will post the Mac version in a day or two.
Directory Setup
All of my PhoneGap apps share the same parent directory, "Repo". So what I propose to do is, make Repo a web site. Now, some people I've talked to prefer to make each individual app its own website. If you do too, this technique will still work for you, just change the location of the website's directory.
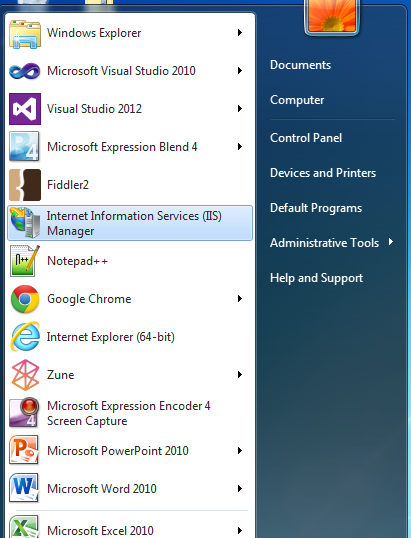
- Begin by starting Internet Information Services 7 aka IIS7.Mine's just happens to be on the start page. Normally it would be under Adminstrative Tools.
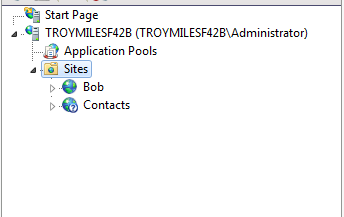
- On the left side, expand your computer name by clicking the disclosure triangle (my computer's name is TROYMILESF42B).
- Expand the Sites list too.
- Right click on Sites.
- Click Add Web Site...
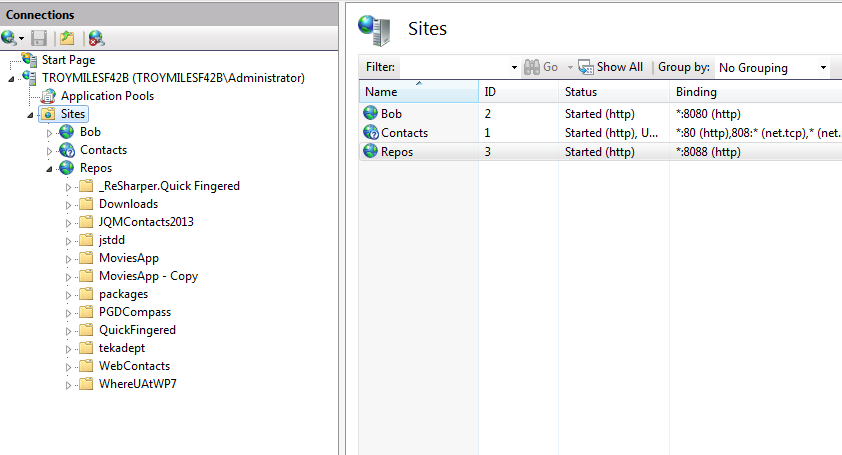
- Give the site a name, mines is "Repos".
- Select an Application Pool, I chose ASP.NET v4.0.
- Select the path to your root folder.
- If your machine runs with security, you may need to give it a user account to run against.
- I highly recommend setting the port to something other than port 80, I am using 8088.
- Make sure the "Start Web site immediately" check box is set.
- Click OK.
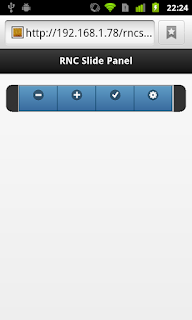
- Using Chrome, navigate to your website.
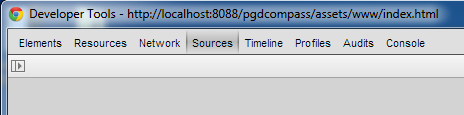
- Enter Ctrl+Shift+I to open Chrome's developer's tools.
- Click on the Sources tab, then the click the disclosure arrow on the top left side to show the source files.
- Double click a file name to open it.
- To set a break point simply click a line number along the left side. Click it again to disable the break point. Right click it and click, Remove breakpoint, to remove it.


This is Great but...
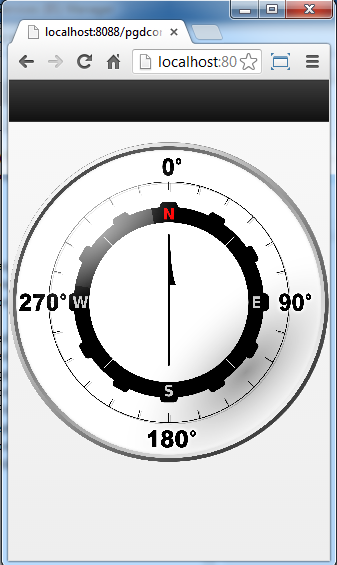
This is all great but we still have a problem. We no longer have a "deviceready" event, so this may break your code. For example, my compass app won't work without the PhoneGap enhancements to the navigator object. But strictly HTML sites will be good to go now.
I am still working on a partial solution to the "deviceready" issue, but it is not ready yet. It is suffice to say that it just mocks the event and places some test values data into the navigator object.